Import Spotify Extended Streaming History into ListenBrainz
ListenBrainz / MusicBrainz is a service that tracks music listens (it had many other components). It can integrate with Spotify so that Spotify notifies it when a song is played, but that only “starts” with songs at that point in time (well it actually imports the last 30 days before then but).
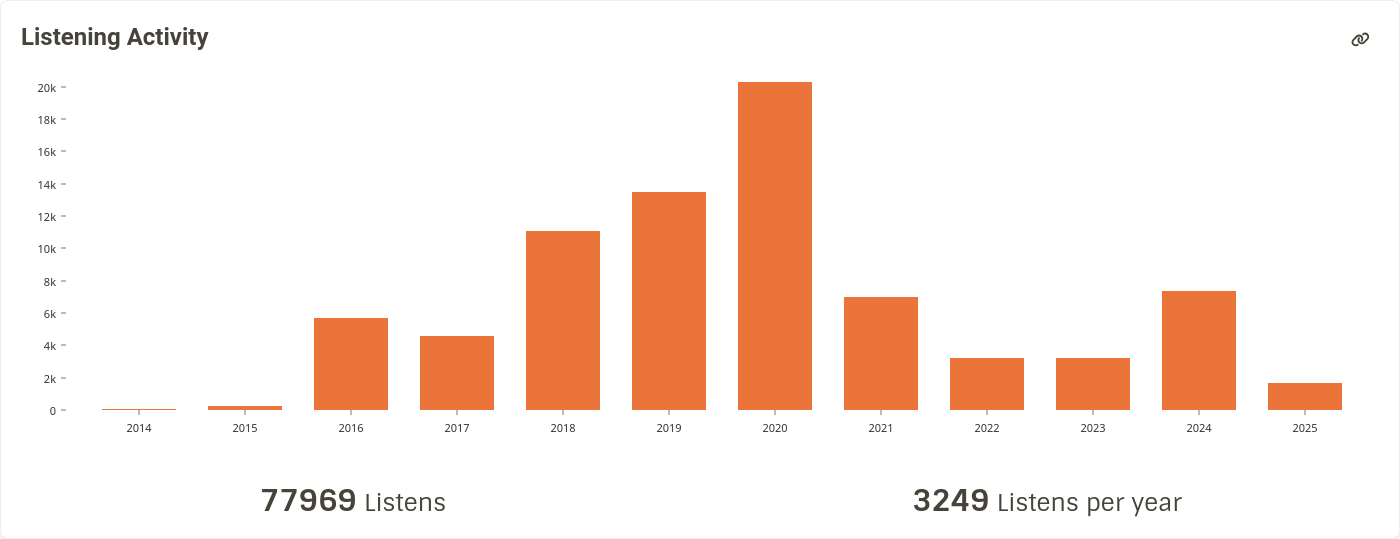
Spotify however allows users to export the full (-ish, as I only see things since 2014) history as a set of JSONs. This is actually a very cool dataset as it includes even brief plays, so you can track skipped tracks and things like that.
But for our purposes here, I wanted to get those pre-2021 stats into ListenBrainz. There are a number of tools to do this, but currently all of them are missing a bit on the filter side (or are buggy? or I am buggy?), so this is my quick way to get those stats in.